
Modeling Information Objects
Applies to: viflow (subscription | 9 | 8) | Article: 1586295 | Updated on 30.04.2024
There are various ways of modeling information objects.
Modeling New Information Objects
How to create new information while modeling the process graphic:
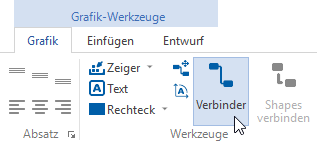
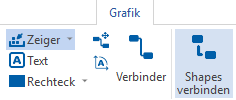
- On the Graphics tab, in the Tools group, click the Connector button .
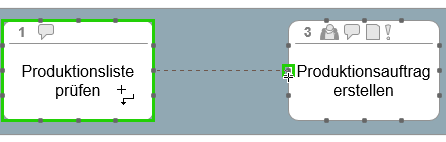
- Click and hold the desired connector start point (usually a connection point on a process icon), and drag to the desired connector end point.
 Alternatively: You can also use the Information (connector) or Information (document) symbols from the viflow template to model the connectors. To do this, click and hold the left mouse button on the shape and drag the shape onto the drawing page so that it sticks to a process. A second connection point must then be set manually:
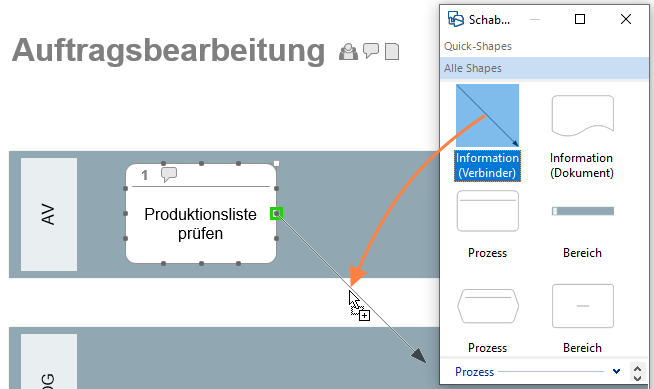
- To name the connector, right-click the connector arrow in the graphic and select [
.png) ] the Properties entry.
] the Properties entry.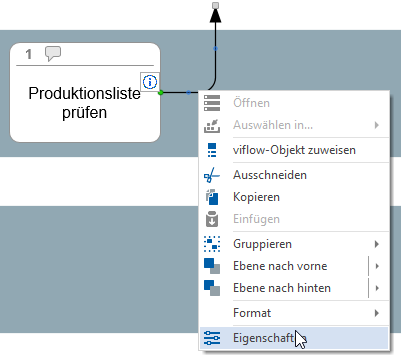 Alternatively: Mark the connection arrow and then click on the Properties button in the Home tab.
The properties window (initially reduced to the General tab) opens: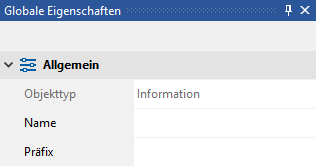
- Click in the Name field.
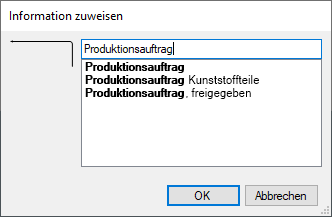
The Assign Information window opens.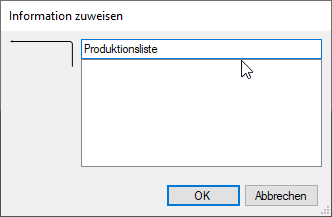 Enter a name for the information here and confirm with OK.
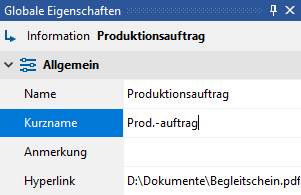
All tabs in the properties window are now visible. - If necessary, enter a short name (this will be used in the graphic) and detail other global and local properties of the information.
- In the properties window [local] you can set the prefix and separator that will appear in front of the short name of the information in the graphic (Prefix > Separator > Short Name).
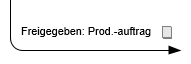
Example: The information with the short name "Production Order", the separator ":" and the prefix "Released" appears in the graphic as "Released: Production Order"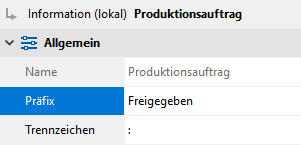
- Mark the next connection arrow (the properties window remains open!) and repeat steps "4" to "6" until all connectors in the graphic have the desired designation.
Modeling existing Information Objects
Information already present in the process model can easily be used in process modeling by dragging it directly from the Information window (or the Information Structure, Overview, Explorer windows) onto the drawing sheet.
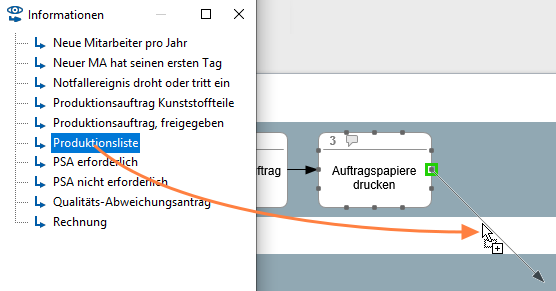
Alternatively, proceed as described in point "1" under Modeling new Information Objects. If you enter the first letters or word fragments, all the information containing them will be listed and offered for use.
Click on the desired list entry and close the window with OK .
Move/break text at Information Object arrow
- Mark the desired information in the graphic (information arrow).
- Click on the information name to highlight the text box.
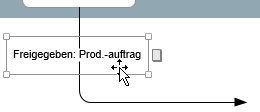 Hold down the left mouse button and drag the text field to the desired position.
 - If you want to create a line break in the text, drag the text box to the desired width.
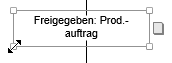 The text is then automatically wrapped and adjusted to the text field.