The viflow objects
Applies to: viflow (subscription | 10 | 9 | 8) | Article: 1554799 | Updated on 21.07.2026
There are three main object types in viflow that have different properties: processes (and branches), information objects and areas.
Processes and branches
A process usually denotes an activity in a process or the process as a whole. It is up to the user how detailed he describes an activity. In most cases, the process begins with a rough description and then goes into more detail. Process graphics consist of several processes/process steps, which can - but do not have to - have further (sub)processes in a process graphic. Branches are used when decisions need to be made at individual process steps. Normally, therefore, the short name of a branch ends with a question mark. In the project, branches are managed like processes, the differences only relate to the symbols used in the graphic.
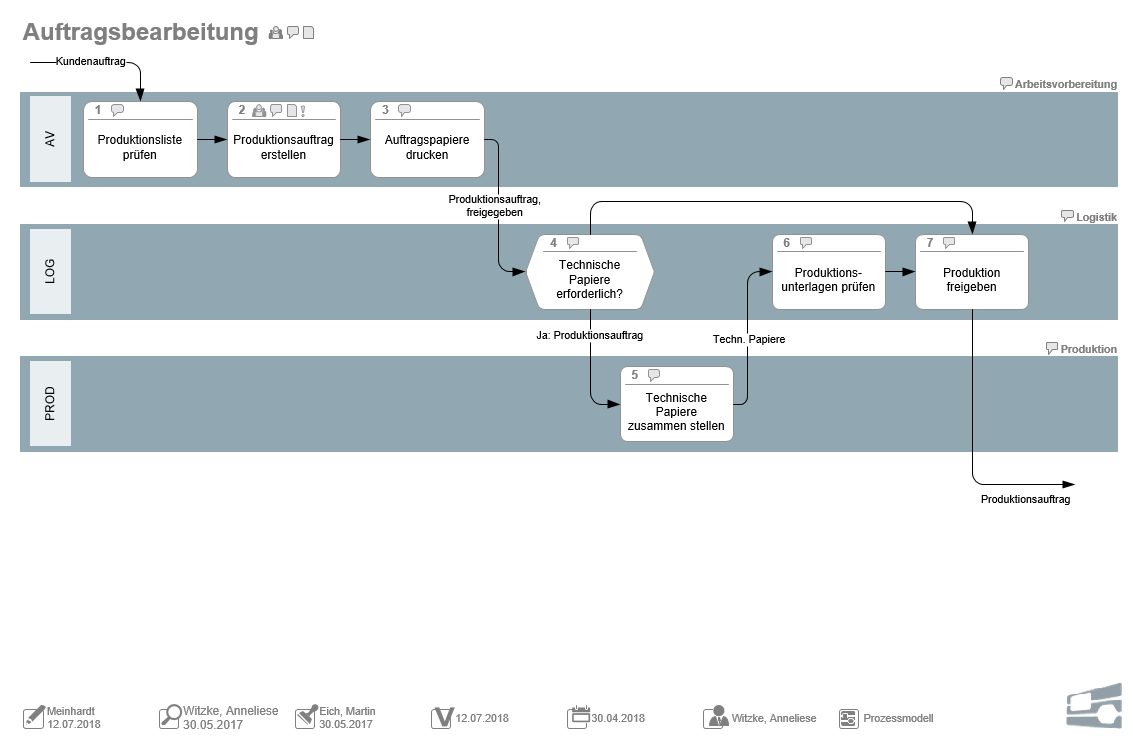
This is what a complete viflow process graphic with processes, information and areas looks like:
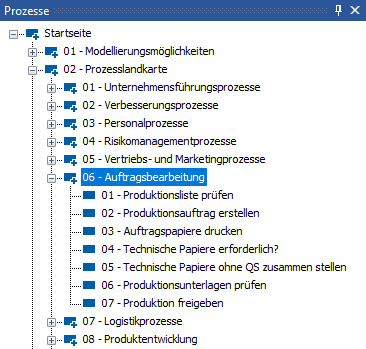
In the Process Structure window (viflow 8: Processes window), this order processing process is displayed as follows:
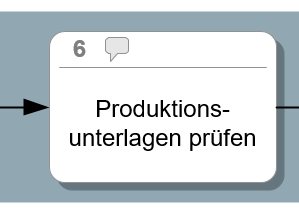
A single process with sub-processes (i.e. with its own graphic) gets a shading:
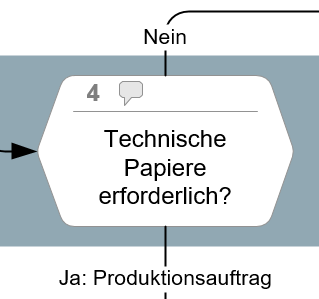
A branch (process with decision) can look like this:
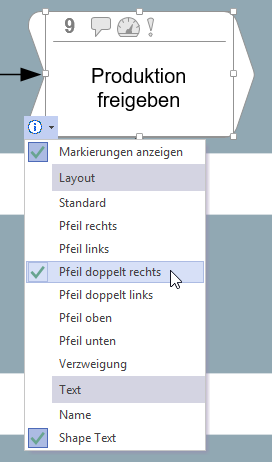
Processes can be assigned different forms:
Information
Information is represented in the process graphic in the form of arrows that are placed between processes or branches and thus symbolize the flow of information (input/output) within a process flow.
This information can be linked to a file via hyperlink and assigned to a process as an applicable document.
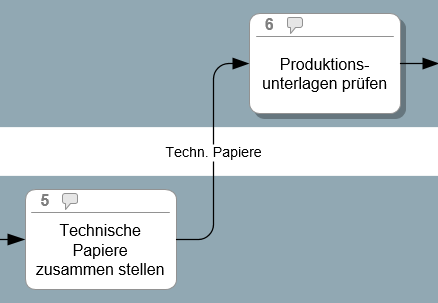
A typical use of information within the process graphic:
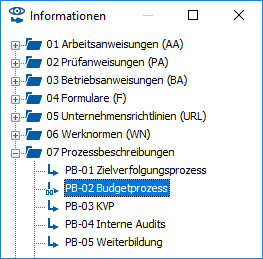
The Information Object is listed alphabetically in the window of the same name, sorted by information object type:
Areas
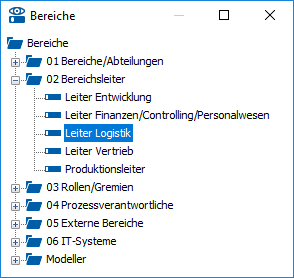
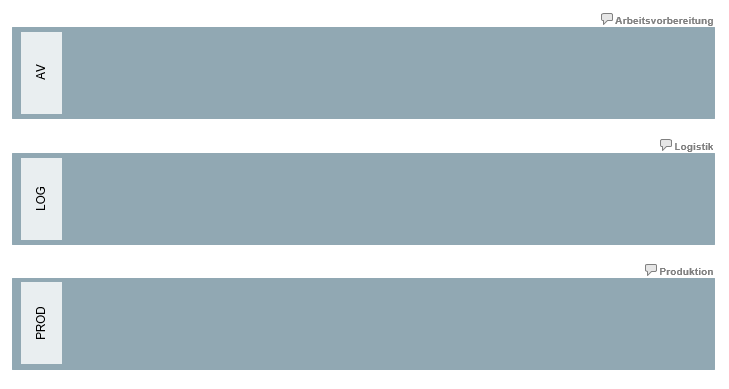
Areas are usually used in viflow to map roles, organizational units or departments in the company. However, an area can also be a person, a position, a system or another group. Areas are displayed in the process graphic as horizontal bars – so-called swim lanes.
The areas (swimlanes) in the process graphic:
In the Areas window, these are sorted by area type and listed alphabetically: